
Weather Data Explained
Weather data underpins a large share of parametric insurance, because so much business revenue moves with the weather.
Rainfall, temperature, wind and snowfall can all be measured, recorded and turned into an index that a policy pays against. Understanding weather data, where it comes from and how it is turned into a trigger, is central to understanding weather parametric insurance.
This guide explains the main types of weather data, the sources behind it, how a weather index is built, and why data quality is so important for cover that pays on the weather.
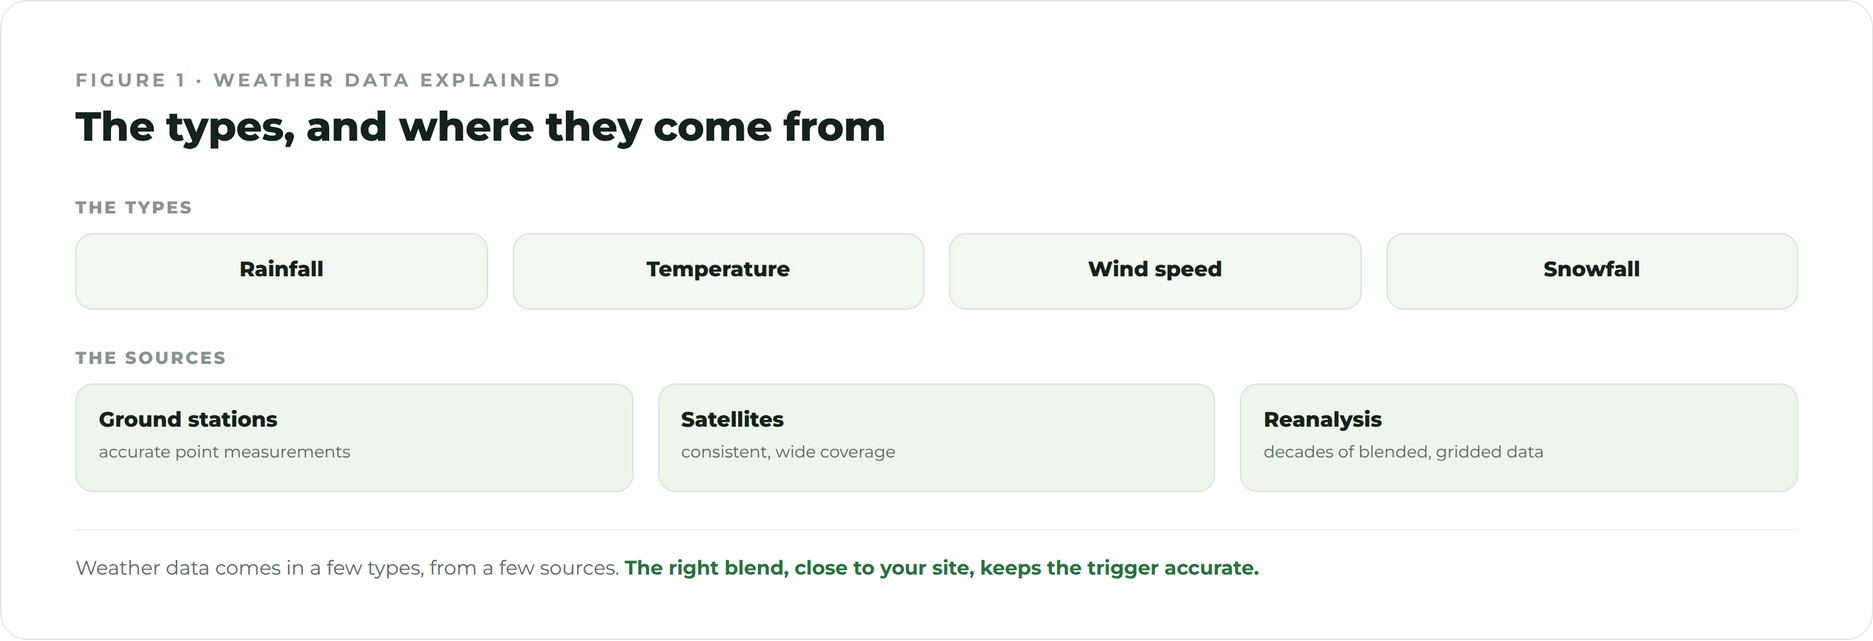
The main types of weather data
- Rainfall and precipitation. Totals over a period, used for drought, flood and agricultural cover.
- Temperature. Including heat and frost, used for heatwave, frost and energy cover.
- Wind speed and gusts. Used for windstorm and renewable energy cover.
- Snowfall and snow depth. Used for winter tourism, transport and construction cover.
Where weather data comes from
Weather data is drawn from national meteorological services, global bodies and reanalysis datasets. Ground stations provide direct local measurements. Reanalysis datasets, which blend observations from many sources into a single, consistent record, are particularly useful for parametric insurance because they provide decades of comparable data across the globe. This long, consistent history is what allows a risk to be modelled and a threshold to be set with confidence.
How a weather index is built
Raw measurements are turned into an index for a specific location and period. The index might be a simple total, such as cumulative rainfall over a growing season, an average, such as mean temperature over a month, or a count, such as the number of days above a temperature threshold. The index is then calibrated so the cover fires when your revenue or operations are actually affected. The choice of index, location and window is what determines how closely the trigger tracks your loss. See index based insurance explained.
Why weather data quality matters
A weather index is only as good as the data behind it. Gaps in a station record, delays in publication, or changes in measurement method can all undermine a trigger. That is why every weather data source is graded before use, on its history, its method and the risk of it being discontinued. A durable, well documented source is worth far more than a convenient one, because the trigger has to work reliably across the whole life of the policy.
Weather data and basis risk
Weather data is also central to managing basis risk. The closer the measurement is to your site, and the better the index matches the way weather affects your business, the smaller the gap between payout and loss. Higher resolution gridded and reanalysis data can reduce spatial basis risk where a nearby station is not available. Choosing and calibrating the right weather data is therefore one of the most important steps in building a weather parametric structure that behaves as the buyer expects.
Ground stations, satellites and reanalysis
Weather data comes in three broad forms, and each has a role. Ground stations give accurate point measurements but only where they are installed, so coverage can be patchy. Satellites cover everywhere consistently but at a coarser resolution and with their own limitations. Reanalysis datasets combine observations from stations, satellites and other sources into a single, gridded, decades long record, which is especially valuable for parametric insurance because it offers both consistency and history. A good structure often blends these forms, using the best available data for the specific location and peril.
Weather data and climate trends
One question that arises with weather data is how to handle a changing climate. If the frequency or severity of an event is shifting over time, a threshold set purely on the distant past may misprice the risk. Careful structuring accounts for trends in the data, giving appropriate weight to recent years and, where relevant, to climate projections, so the trigger reflects the risk over the policy period rather than the risk of a decade ago. Handling this well is part of what separates a robust weather structure from a naive one.